- Scaling, particulates, biological growth and reaction products are the main fouling mechanisms, often acting together.
- Rising approach temperature and pressure drop are the clearest signs, and most plants already record them.
- Fouling costs show up as extra fuel, reduced throughput and harder, longer cleaning jobs.
- Linking cleaning intervals to measured performance beats cleaning by calendar or turnaround habit.
A heat exchanger rarely fails all at once. It fouls gradually: a thin layer of scale, a film of biological growth, coke or polymer on the hot side, sediment settling in low-velocity zones. Each layer adds resistance to heat transfer, and the plant compensates without anyone deciding to. Furnaces fire harder, coolers run closer to their limits, pumps work against rising pressure drop, and eventually throughput is trimmed to keep the process inside its constraints.
Because none of these changes is dramatic, fouling is easy to accept as normal. It is still a cost, paid every day in fuel, power and lost production, and it is often one of the more controllable costs on a site.
How exchangers foul
There are several fouling mechanisms, and most services involve more than one:
- Scaling: dissolved salts such as calcium carbonate and sulphate precipitate on heated surfaces, common in cooling water and seawater systems.
- Particulate fouling: suspended solids, sand and corrosion products settle wherever velocities are low.
- Biological fouling: bacteria, algae and marine organisms colonise surfaces in cooling water and seawater circuits.
- Chemical reaction fouling: coke, polymers and gums form from process fluids at elevated temperature.
- Corrosion fouling: corrosion products build up on the heat transfer surface and add to the deposit.
In the Gulf, high cooling water temperatures, widespread seawater use and airborne dust all push fouling in the wrong direction, so design fouling allowances borrowed from cooler climates can prove optimistic.
The signs worth watching
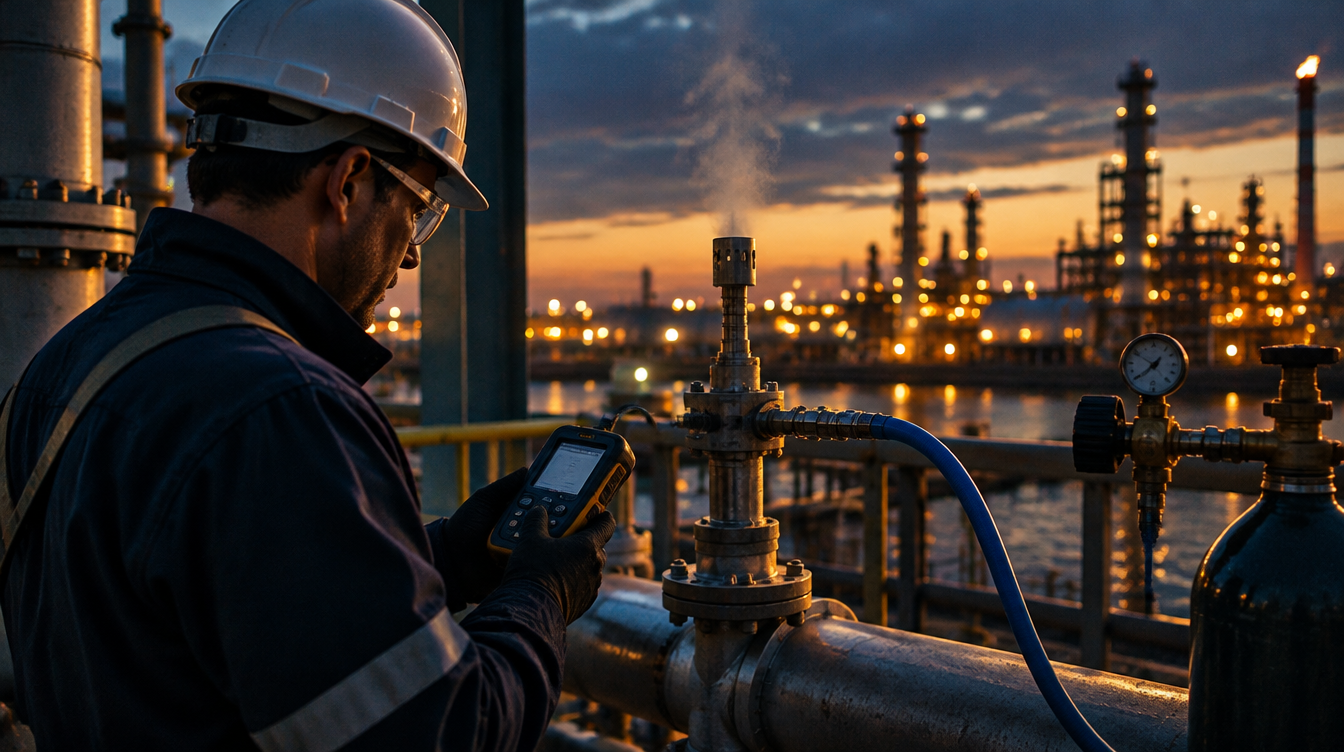
The clearest indicators are usually already in the plant historian. A rising approach temperature, the gap between one stream's outlet and the other stream's inlet, shows that the exchanger is transferring less heat than before. Increasing pressure drop at constant flow shows that deposits are narrowing the flow path. Calculating the overall heat transfer coefficient from flows and temperatures, and trending it over time, combines these signals into one figure that is easier to compare against the clean condition.
Indirect signs matter too: a furnace firing more for the same feed, a cooling water pump running closer to its limit, control valves sitting further open, or operators trimming rates on hot afternoons.
Fouling does not announce itself; it quietly moves your plant's limits closer.
Where the money goes
The impact of fouling falls into three areas. Energy is the first: when a preheat train fouls, the furnace downstream has to make up the shortfall, which means more fuel and more emissions. Throughput is the second: when an exchanger becomes the limiting item, the whole unit may have to run below its design rate, especially in the hottest months. Maintenance is the third: heavily fouled bundles take longer to clean, may need more aggressive methods, and can suffer under-deposit corrosion that shortens their life.
The size of each effect depends on the service, the exchanger's position in the process and the value of the product. It is worth estimating for your own critical exchangers rather than relying on generic figures, because the answer often changes which exchangers deserve attention first.
Monitoring that leads to decisions
Monitoring only has value if it changes when and how exchangers are cleaned. A simple programme works well:
- Identify the exchangers whose performance most affects energy use or throughput.
- Establish a clean baseline for heat transfer coefficient and pressure drop for each one.
- Trend those values from existing plant data, with a regular, scheduled review.
- Set intervention thresholds that reflect the economics of each exchanger.
- Feed the trends into turnaround scopes and any on-line cleaning plans.
Planning the clean
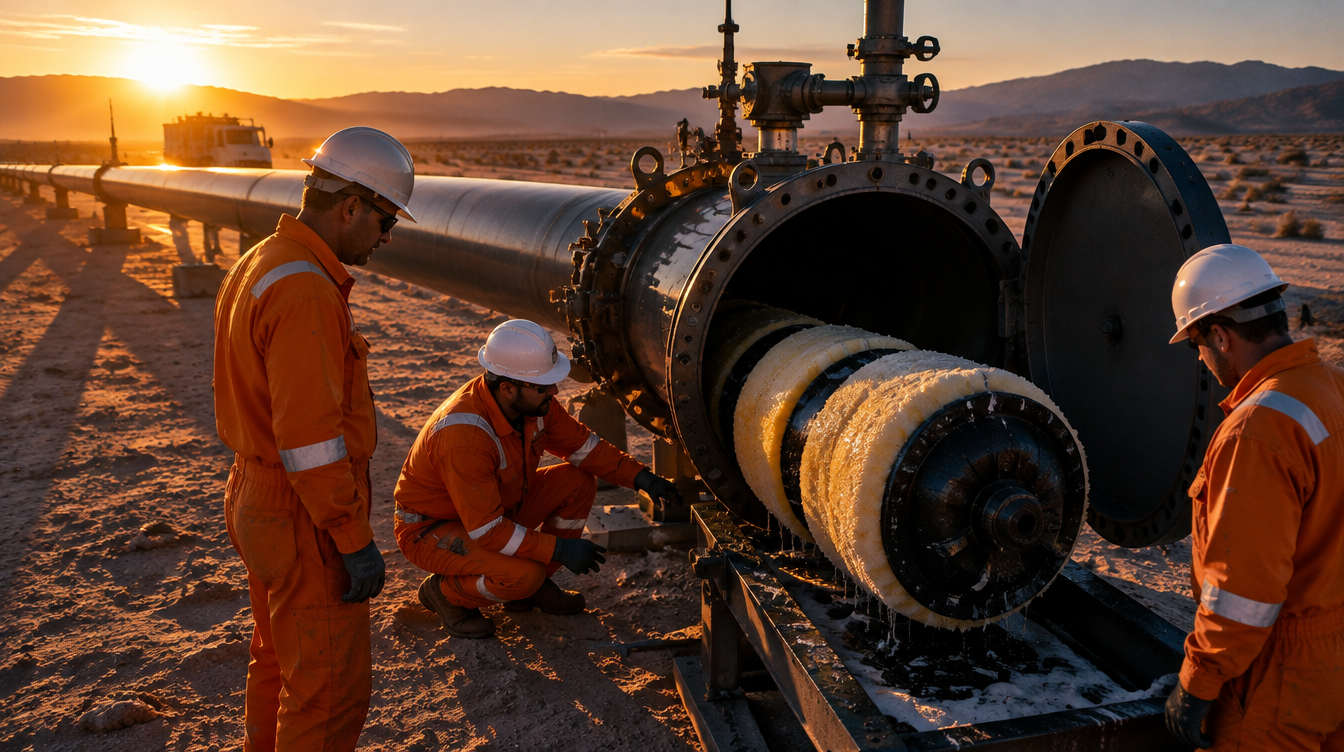
Cleaning intervals based on the calendar or the last turnaround tend to clean some exchangers too often and others too late. Linking intervals to measured performance gives a better balance between downtime and lost efficiency. Where exchangers can be isolated in service, cleaning between turnarounds may be worthwhile.
Before any clean, sampling the deposit tells you what you are removing and helps select the method, whether chemical, mechanical or a combination. After the clean, recording restored performance confirms the work and resets the baseline. Upstream causes, such as cooling water treatment, filtration or operating temperatures, also deserve attention, since slowing fouling is often cheaper than repeatedly removing it.
A practical first step
Choose the three exchangers that matter most to your unit's energy use or capacity and trend their heat transfer coefficient and pressure drop over the past year. The pattern will usually show where to focus first. If it would help to plan a cleaning campaign around those findings, KARR's process services team is available to discuss the options.
Heat exchangers, Fouling, Energy efficiency